Neighborhood Assessment - North of Broadway
Data sources: 2017 5-year ACS
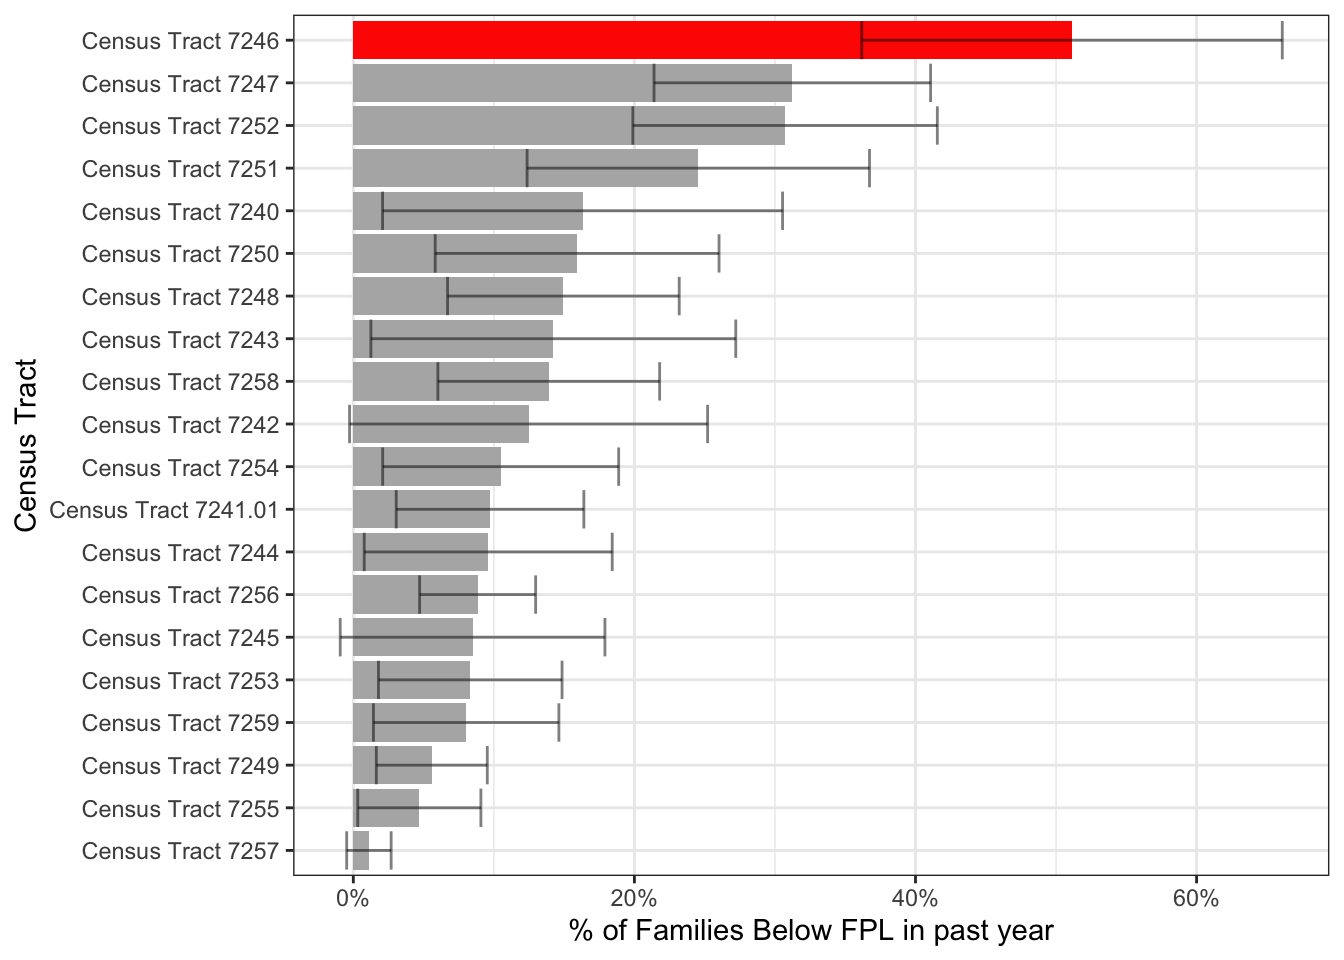
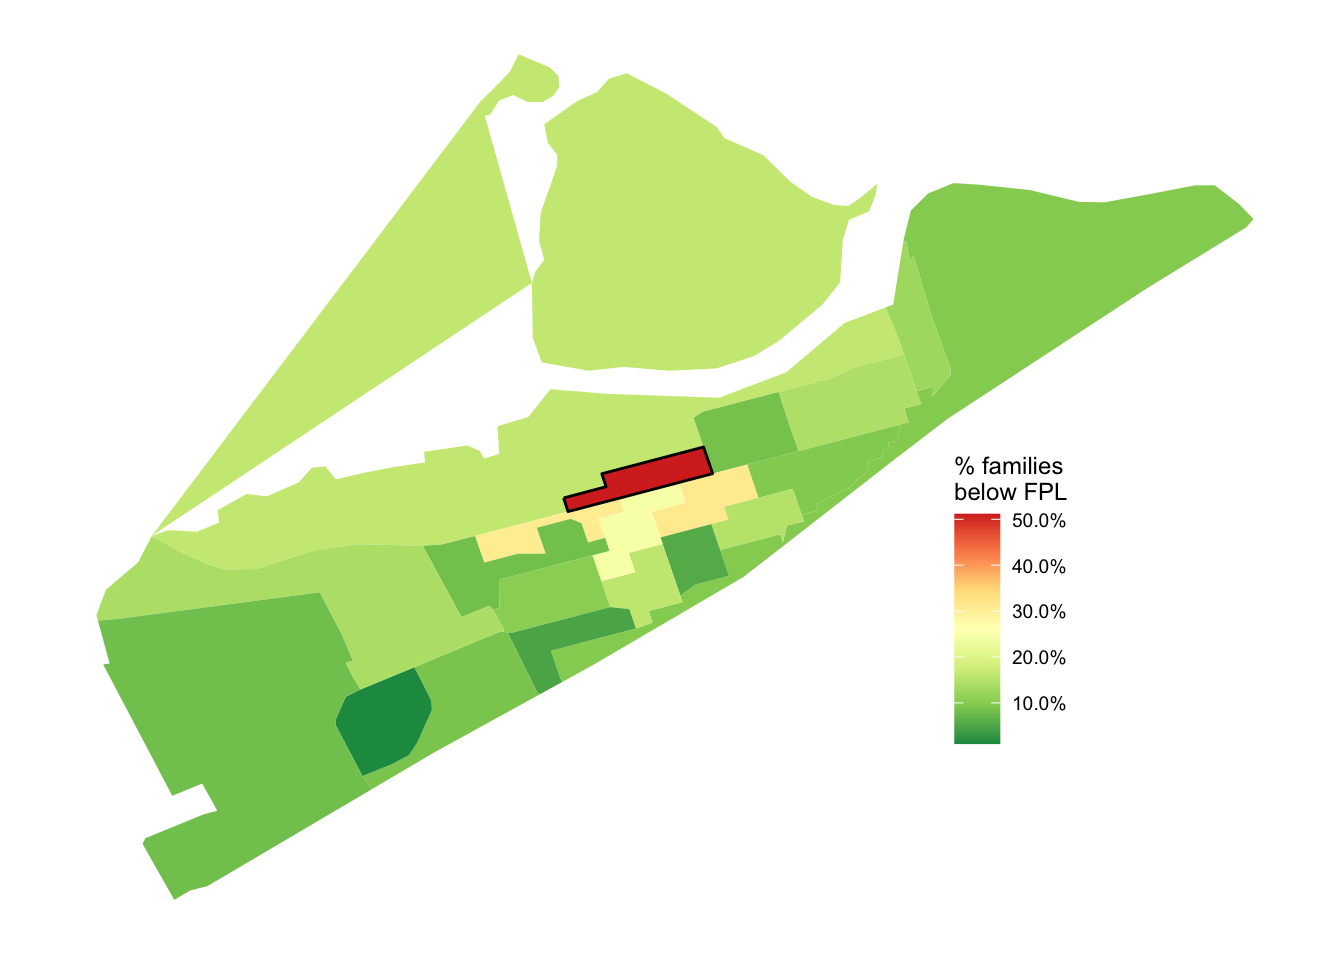
Families living in poverty
Based on table B17015, showing percent of familes who were below the federal poverty line (FPL) in the past 12 months
## $Overall
## 14% (+/- 2.1%)
##
## $Ours
## 51.1% (+/- 15%)
The pooled estimate of families living below the FPL in the past 12 months on the island is 14% (+/- 2.1%) but our tract has 51.1% (+/- 15%) families living below the FPL
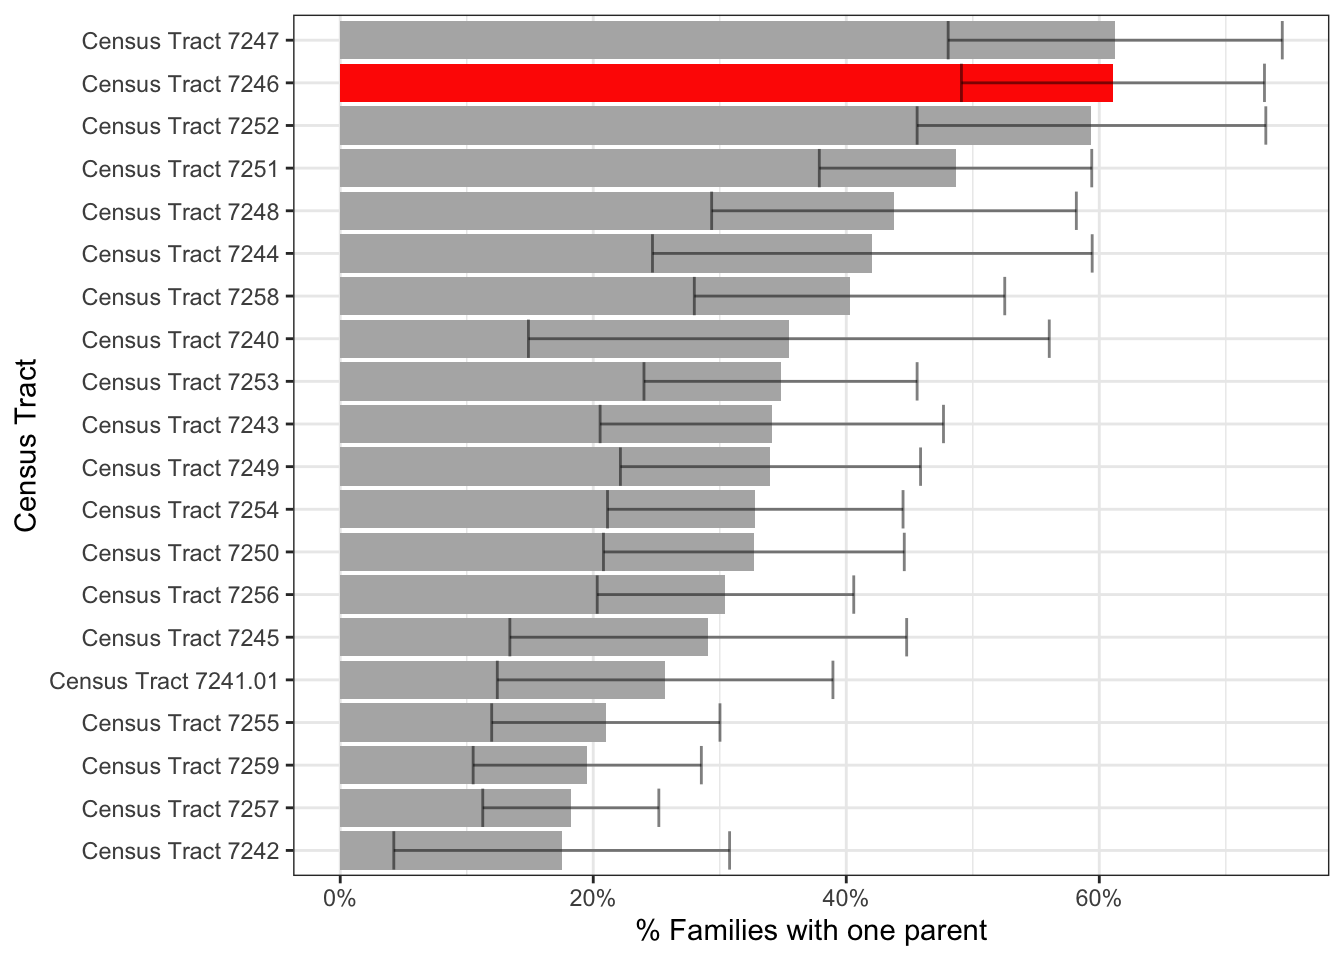
Single Parent Households
Based on table S1101, showing percent of familes who are single-parents
## $Overall
## 35.7% (+/- 3%)
##
## $Ours
## 61.1% (+/- 12%)
The pooled estimate of single-parent families on the island is 35.7% (+/- 3%) but our tract has 61.1% (+/- 12%) of families only having one parent in the household
Median household income
Based on table B19013, showing median household income
Unemployment
Based on table B23025, showing percent of civilian labor force who is unemployed
## $Overall
## 7.5% (+/- 1.2%)
##
## $Ours
## 22% (+/- 8.9%)
The pooled estimate of unemployment on the island is 7.5% (+/- 1.2%) but our tract has 22% (+/- 8.9%) of the civilian labor force who is unemployed
Race
Based on table B03002, showing race & hispanic ethnicity
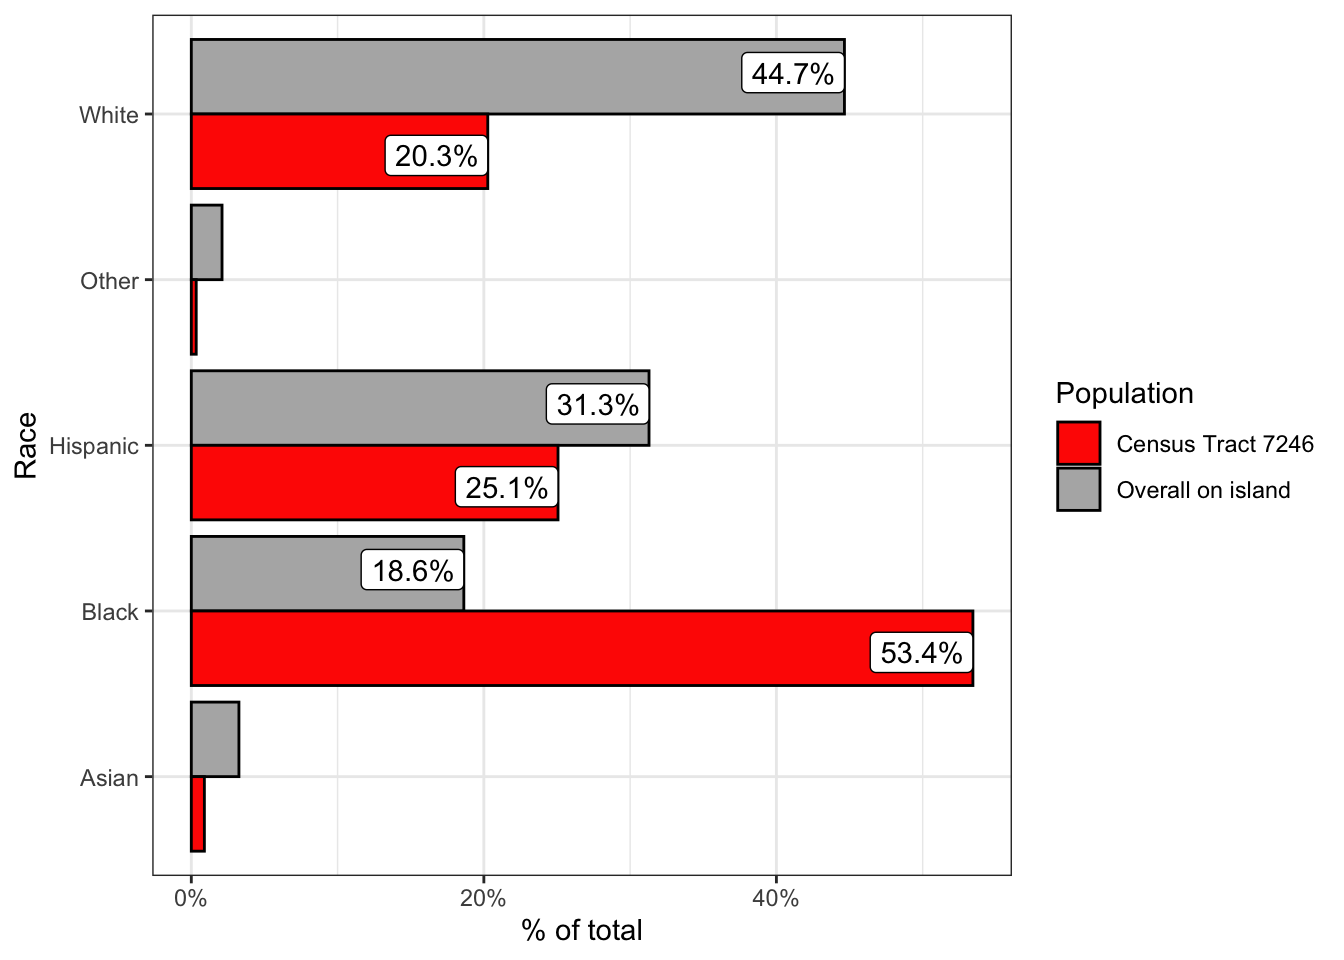
| variable | Census Tract 7246 | Overall on island |
|---|---|---|
| Black | 53.4% | 18.6% |
| Hispanic | 25.1% | 31.3% |
| White | 20.3% | 44.7% |
| Asian | 0.9% | 3.3% |
| Other | 0.3% | 2.1% |
Hunter Ratliff, MD, MPH
Infectious Diseases Fellow
My research interests include epidemiology, social determinants of health, and reproducible research.