Minor vs. Major Leg Amputation in Adults with Diabetes: Six-Month Readmissions, Reamputations, and Complications
Abstract
Aims: The objective of this study was comparing medium-term outcomes between comparable minor and major amputations in adults with diabetes.
Methods: We used data from the 2016-2017 National Readmissions Database to construct a representative cohort of 15,581 adults with diabetes with lower extremity amputations. Patients were categorized by level of index amputation (major/minor), and propensity score matched to compare outcomes in candidates for either level of amputation. Readmission and reamputations were assessed at 1, 3, and 6 months following index amputation.
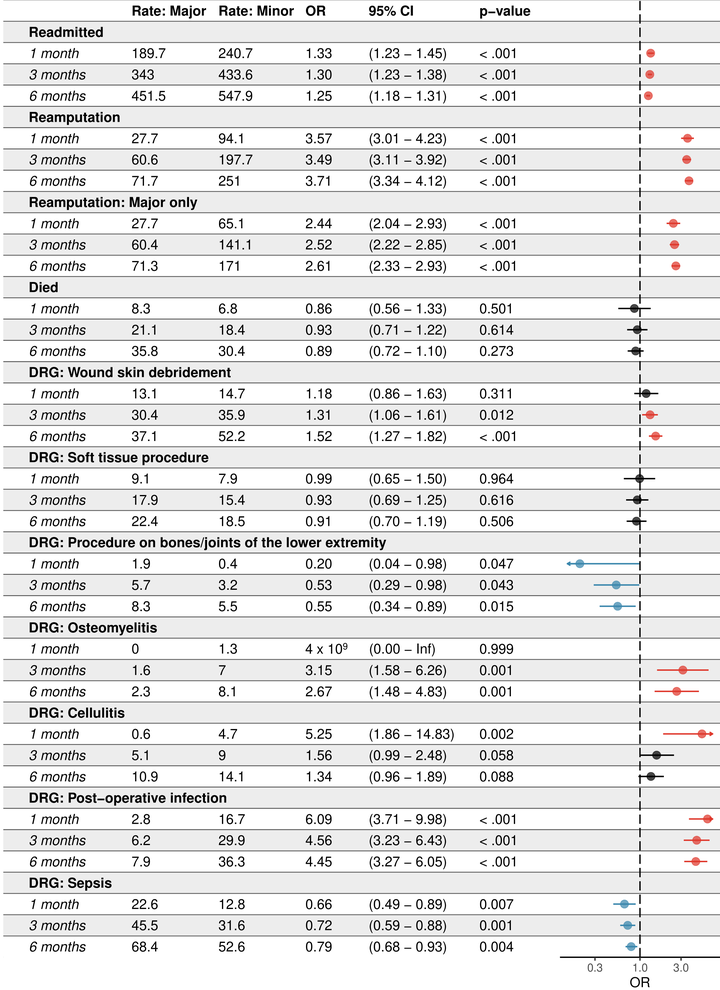
Results: In the 6 months following index amputation, large proportions of patients were readmitted (n = 7597, 48.8%) or had reamputations (n = 1990, 12.8%). Patients with minor amputations had greater odds of readmission (OR = 1.25; 95% CI 1.18-1.31), reamputation (OR = 3.71; 95% CI 3.34-4.12), and more proximal reamputation (OR = 2.61; 95% 2.33-2.93) (all P < 0.001). Further, minor amputation patients had higher and lower odds of readmission for postoperative infection (OR = 4.45; 95% CI 3.27-6.05), or sepsis (OR = 0.79; 95% CI 0.68-0.93), respectively.
Conclusion: Patients desire to save as much limb as possible and should be counseled on higher risk for reamputation, readmission, and infection with minor amputations.
The image at the top of the page is a graphical adaptation of Table 3 of the pre-print manuscript, demonstrating the conditional logistic regression for outcomes at 1, 3, and 6 months.
Odds ratios (OR) and 95% confidence intervals (95% CI) are presented for the minor amputation group, as compared to the major amputation group. Rate: Major and Rate: Minor are the rates per 1,000 patients that each outcome occurred, stratified by index amputation group, in the matched cohort. The prefix “DRG” indicates the outcome is cause-specific readmission, as assessed by DRG codes. The odds ratio for readmission for osteomyelitis at 1 month is not shown.
Arrows on the plot of odds ratios and confidence intervals (right-most column) indicate that the confidence intervals extend beyond the margin of the plot. Odds ratios are presented in color if the outcome was significantly more common in minor (red) or major amputations (blue), and are otherwise black if the p-value was not p < 0.05
Hunter Ratliff, MD, MPH
ID faculty & healthcare epidemiologist at WVU Hospitals
My interests include epidemiology, infection prevention & control, and reproducible research.